Python Matplotlib
绘图基础
基本绘图功能
matplotlib是一个Python用来绘制二维图片的模块,最初模仿Matlab,但是现在是以面向对象的方式提供。该库用纯Python代码编写,为了提高效率重度依赖numpy模块。
该模块的设计哲学是可以用最少的命令来绘图,你可以通过一个命令来绘图,而不需要创建对象、设置属性、调用函数等等做一系列动作才能工作。
matplotlib API包括三层,最底层是画布,用来实际绘制图像, matplotlib.backend_bases.FigureCanvas。中间层是渲染层,用来设定如何绘制,matplotlib.backend_bases.Renderer。最上层是绘图层,是一个知道如何绘图的对象,一般用户只需要和该层打交道,matplotlib.artist.Artist。而绘图层包括两类对象,元素和容器,元素就是我们想要画到画布去的东西,如Line2D、矩形、文字等,容器则是装载元素的东西,如Axis、Axes和Figure。标准的做法是先创建Figure,用Figure创建一个或多个Axes/Subplot,然后用Axes实例来添加元素。正是因为所有元素是基于Axes添加,所以Axes可以认为是 matplotlib API中最重要的类。
一个典型的绘图过程如下所示:
# -*- coding:utf-8 -*-
import matplotlib.pyplot as plt
import numpy as np

fig = plt.figure()                      # create figure
x = np.linspace(0.0, 5.0)
y = np.cos(2 * np.pi * x) / np.exp(x)
ax = fig.add_axes([0.2, 0.6, 0.6, 0.3])
ax.set_ylabel(r'$ \frac{2 \pi x}{\epsilon^x} $', fontsize=20)
ax.plot(x, y)

ax = fig.add_axes([0.1, 0.1, 0.4, 0.4])
ax.hist(np.random.randn(1000), 50, facecolor='red', edgecolor='yellow')
plt.show()
值得注意的是pyplot保持了当前图像和绘图区,所以可以通过函数直接访问当前图像和子图。当前图像和子图可以通过plt.gcf()和plt.gca()获取,即Get Current Figure/Axes。命令plt.plot()实际上先获取当前ax,再调用ax.plot()绘图。对应的scf()和sca()用于保存当前图像和子图。
绘图函数
二维绘图是最常用的函数,参数传递也很简单,两组列表对应x和y坐标序列,虽然支持一个命令绘制多个线,但是建议一次只绘制一条线。
plot(x, y)        # plot x and y using default line style and color
plot(x, y, 'bo')  # plot x and y using blue circle markers
plot(y)           # plot y using x as index array 0..N-1
plot(x1, y1, 'g^', x2, y2, 'g-') # plot mutiple lines in one command
plot([1,2,3], [1,2,3], 'go-', label='line 1', linewidth=2)
plot([1,2,3], [1,4,9], 'rs-',  label='line 2')
- matplotlib.pyplot.plot_date(x, y, fmt=u'o', tz=None, xdate=True, ydate=False, hold=None, **kwargs)
- matplotlib.pyplot.plotfile(fname, cols=(0, ), plotfuncs=None, comments=u'#', skiprows=0, checkrows=5, delimiter=u', ', names=None, subplots=True, newfig=True, **kwargs)
相对来说plotfile灵活性不是很好,更灵活的做法是通过matplotlib.pylab.csv2rec()载入记录,再分别调用需要的函数来绘图。
- fname
- 要绘制的文件
- cols
- 要绘制的列,如果只有一列,作为y坐标绘制,如果有多列,第一列作为x坐标,剩余的作为多个subplots,如果禁止subplots就作为多条线绘制。
- plotfuncs
- 默认用'plot',可选择:'semilogy'、'fill'、'bar'等。要注意的是plotfuncs是一个字典,键是cols中的元素。
figure()用于创建一个新的图像,如果创建了多幅图像,调用close是必要的,否则会导致内存泄漏。参数num就是ID号,而不是说会创建num个图像。
subplot()用于创建子图,一幅图片会被等分成指定的行和列:
subplot(nrows, ncols, plot_number)
axes()用于放置子图位置:
axes()                                  # 创建subplot(111)全局窗口
axes(rect, axisbg='w')                  # 自定义窗口
# rect=[left, bottom, width, height],值已经归一化[0, 1]
axes(h)                                 # h是一个axes实例
属性设置
一般来说比较常用需要设置的参数包括:颜色、线型线宽、采样点大小形状、标签等。如果不传递额外参数则打印可以设置的参数信息,相当于帮助文档。对应的getp()用于获取对象的属性信息。
axis()                                  # get [xmin, xmax, ymin, ymax]
axis([xmin, xmax, ymin, ymax])          # set axis
axis('off')                             # turns off the axis lines and labels
axis('equal')                           # x/y 等距
axis('scaled')                          #
axis('tight')                           # show all data
axis('image')
axis('auto')/axis('normal')             # 请不要使用

# xlim, ylim
xmin, xmax = xlim()   # return the current xlim
xlim((xmin, xmax))    # set the xlim to xmin, xmax
xlim(xmin, xmax)      # set the xlim to xmin, xmax
文字标注
常用的标签包括:xlabel()、ylabel()、title()、text()等。所有文字部分均支持LaTeX表达式。
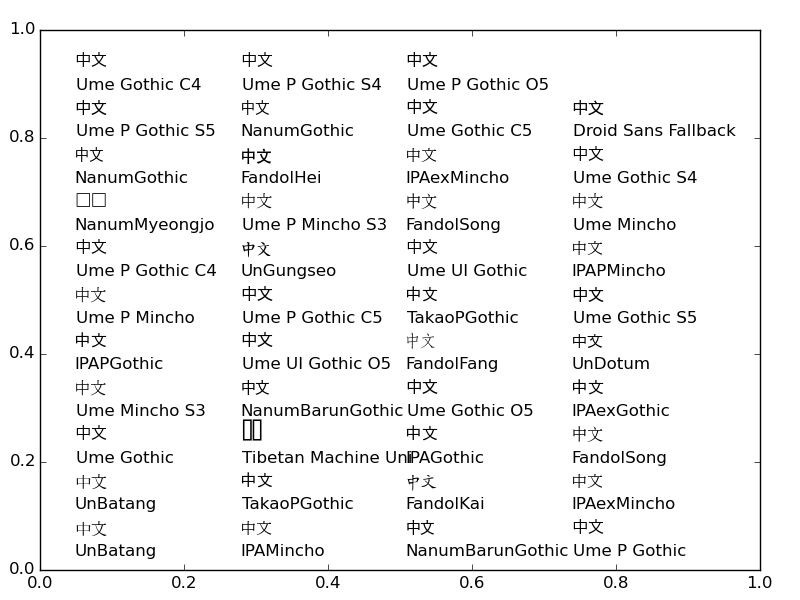
文字部分可以支持中文,但是要选择正确的字体,否则无法正确显示。
#!/usr/bin/env python
# -*- coding:utf-8 -*-

import matplotlib.font_manager as fm
import matplotlib.pyplot as plt
import os

ttfs = fm.fontManager.ttflist
ax = plt.figure().add_subplot(111)
plt.subplots_adjust(0.05, 0.05, 0.95, 0.95, 0, 0)
fonts = [font.name for font in ttfs if os.path.exists(font.fname) and
         os.stat(font.fname).st_size > 4e6]
dx, dy = 0.23, 0.95 / (len(fonts) / 4 + (len(fonts) % 4 != 0))
x, y = 0.05, 0.8 * dy
for font in fonts:
    ax.text(x, y, u"中文", {'fontname': font}, transform=ax.transAxes)
    ax.text(x, y - dy / 2, font, transform=ax.transAxes)
    x += dx
    if x + dx >= 1.0:
        y += dy
        x = 0.05
plt.show()
# plt.savefig('fig/matplot/zhfont.png')